USDA Crop Condition Ratings 2026: Weekly Ratings, Trends, and Key Updates
Every Monday afternoon during the growing season, grain traders, farmers, and analysts refresh the same page. The USDA crop condition ratings 2026 release shapes prices, planting decisions, and harvest expectations across the Corn Belt and beyond. Here is how the ratings work and what to watch.
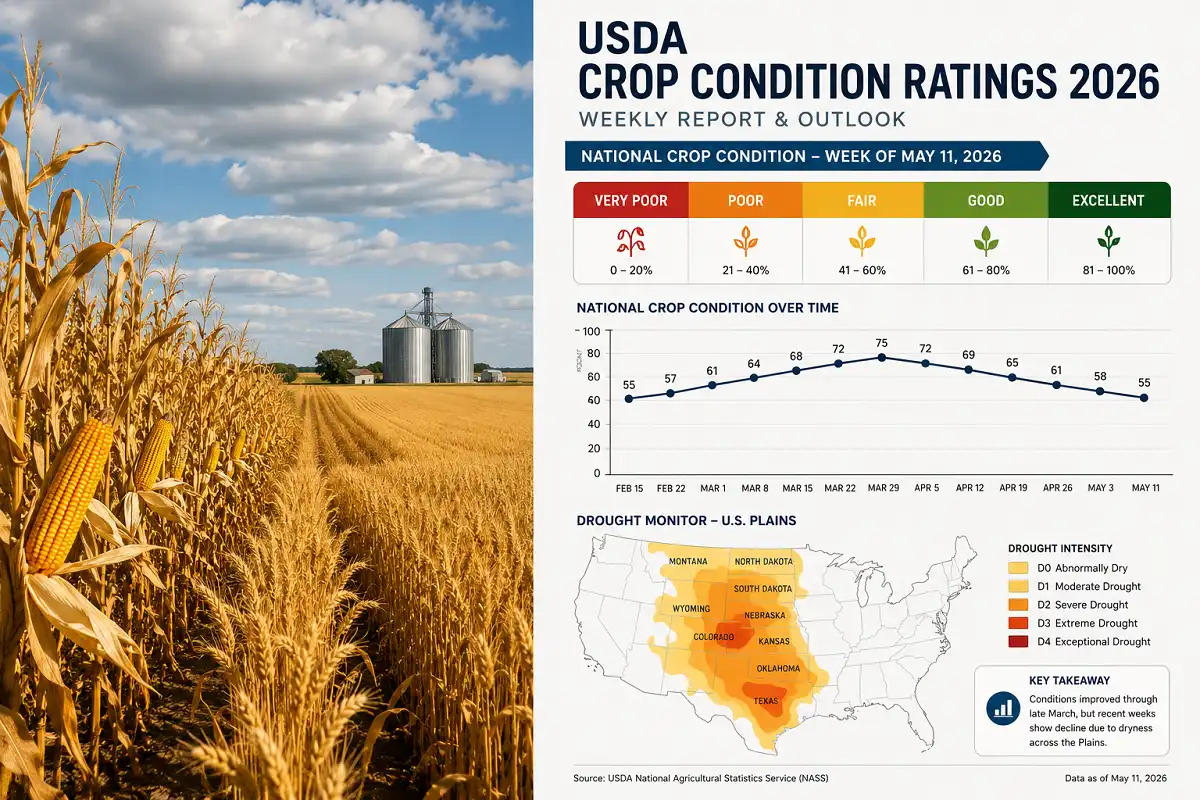
The USDA rates each major crop weekly on a five-category scale from very poor to excellent. Analysts track the “good to excellent” share as the headline number. In 2026, drought in the Plains and uneven Midwest rainfall have driven sharp week-to-week swings.
What Are USDA Crop Condition Ratings?
USDA crop condition ratings measure how well major U.S. crops are developing during the growing season. The National Agricultural Statistics Service (NASS) publishes them inside the weekly Crop Progress report, released most Mondays at 4:00 p.m. Eastern from April through November.
Each crop gets sorted into five buckets: very poor, poor, fair, good, and excellent. State-level enumerators and county extension staff submit observations. NASS aggregates them into state and national percentages.
The number most people quote is the combined “good to excellent” figure. When corn sits at 70% good to excellent, it means 70% of the surveyed acres fall into those top two categories. Traders treat a rising figure as bearish for prices and a falling figure as bullish.
How the USDA Crop Condition Ratings 2026 System Works
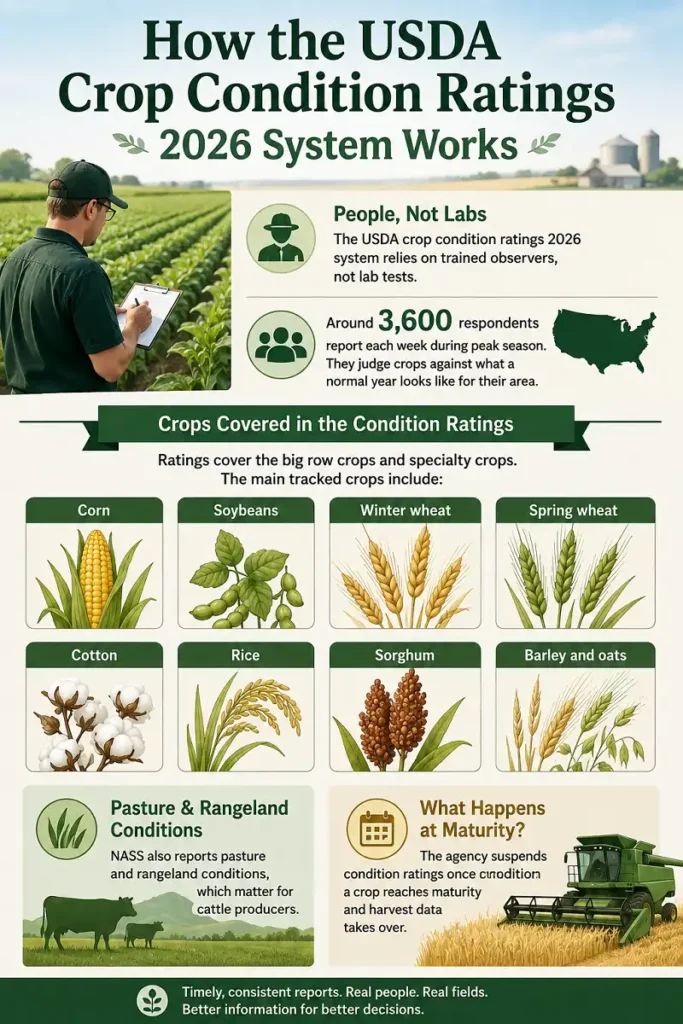
The USDA crop condition ratings 2026 system relies on trained observers, not lab tests. Around 3,600 respondents report each week during peak season. They judge crops against what a normal year looks like for their area.
Ratings cover the big row crops and specialty crops. The main tracked crops include:
- Corn
- Soybeans
- Winter wheat
- Spring wheat
- Cotton
- Rice
- Sorghum
- Barley and oats
NASS also reports pasture and rangeland conditions, which matter for cattle producers. The agency suspends condition ratings once a crop reaches maturity and harvest data takes over.
What Each Rating Category Means
The five categories describe how far a crop sits from its yield potential. Very poor means extreme loss is likely. Poor means heavy loss is likely. Fair means below-normal output is expected. Good means near-normal prospects. Excellent means yield above normal looks likely.
NASS gives enumerators written guidance for each category. Even so, the calls stay judgment-based. That is why the USDA crop condition ratings 2026 figures shift with observer perception, not just with the weather. A run of hot days can pull a state from good toward fair in a single week.
Why the Ratings Are Subjective
The ratings depend on human judgment. That is their strength and their weakness. An enumerator in Iowa and one in Nebraska might score identical-looking fields differently based on local expectations. Because of this, week-to-week direction often matters more than the exact number.
Purdue University agricultural economists have shown that early-season ratings correlate loosely with final yield. The link tightens as the season progresses. By July and August, the good-to-excellent figure for corn tracks final yield far more closely than it does in May.
USDA Crop Condition Ratings 2026: Season Timeline
The USDA crop condition ratings 2026 calendar follows the crop cycle. Reporting ramps up in spring and winds down in late fall.
- April: Winter wheat conditions resume. Planting progress for corn begins.
- May: Corn and soybean emergence tracked. First full condition ratings appear.
- June to August: Peak season. All major crops rated weekly.
- September to November: Ratings taper as harvest advances.
The first 2026 corn and soybean condition ratings came in below the five-year average, according to NASS Crop Progress data. That soft start echoed what earlier coverage found when the season’s first crop ratings landed on the weak side, with dry topsoil reported across parts of the western Corn Belt.
What the 2026 Ratings Show So Far
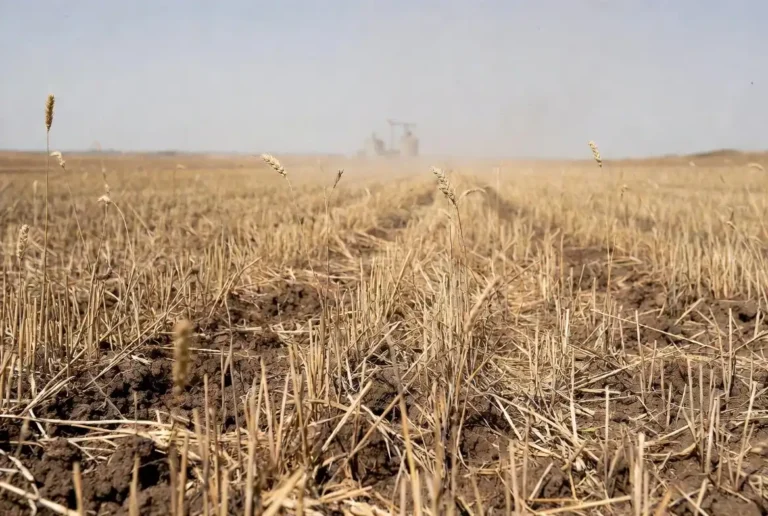
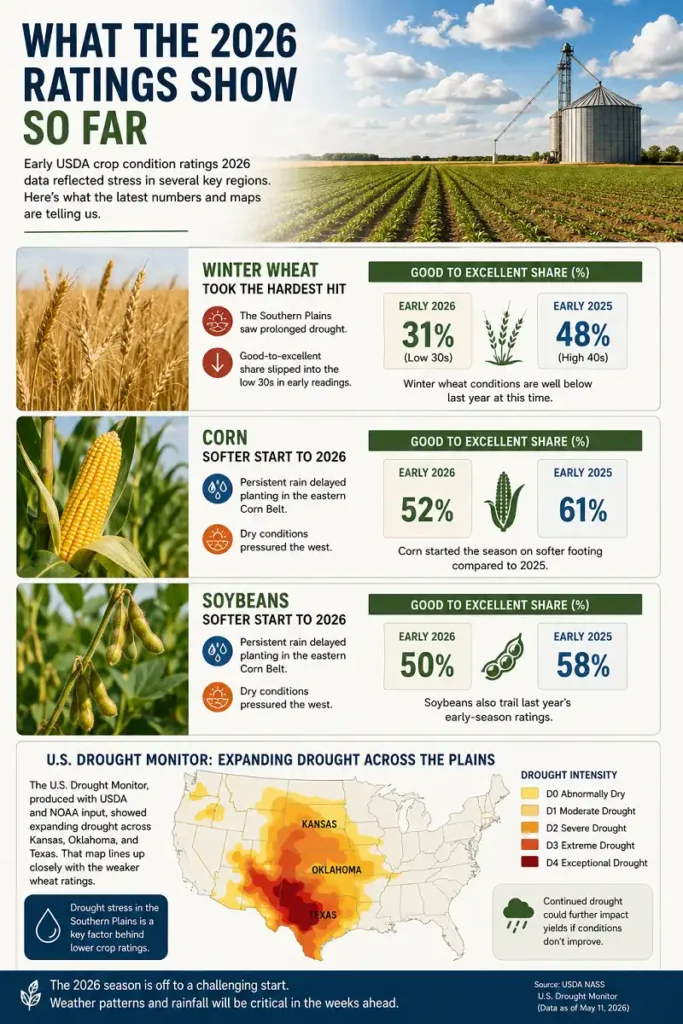
Early USDA crop condition ratings 2026 data reflected stress in several key regions. Winter wheat took the hardest hit. The Southern Plains saw prolonged drought, and the good-to-excellent share for winter wheat slipped into the low 30s in early readings.
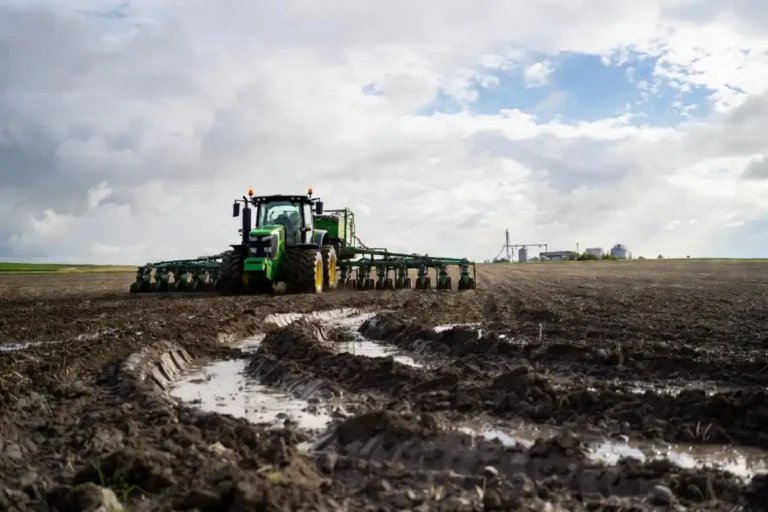
Corn and soybeans started the season on softer footing than 2025. Persistent rain delayed planting in the eastern Corn Belt, while dry conditions pressured the west. This split pattern defined the early USDA crop condition ratings 2026 picture.
The U.S. Drought Monitor, produced with USDA and NOAA input, showed expanding drought across Kansas, Oklahoma, and Texas. That map lines up closely with the weaker wheat ratings.
Winter Wheat Under Pressure
Winter wheat conditions in 2026 ranked among the weakest in recent years. The crop faced a dry fall establishment period followed by a harsh Plains winter. NASS data placed the good-to-excellent figure well below the levels seen in 2024 and 2025.
Kansas, the top winter wheat state, reported large shares of its crop in poor or very poor condition. Analysts linked this to the smallest projected wheat crop in decades, which raises real questions about how a tight wheat supply feeds into bread prices this year.
Corn and Soybeans in 2026
Corn and soybean ratings started the 2026 season below trend. The USDA crop condition ratings 2026 numbers for corn opened in the mid-60s good to excellent, under the strong readings of the prior year. Soybeans followed a similar path.
Weather drove most of the variance. Fields in Illinois and Indiana battled excess moisture. Fields in Nebraska and western Iowa needed rain. As planting wrapped up across the Corn Belt, ratings stabilized but stayed sensitive to each forecast.
How 2026 Compares to Recent Years
The USDA crop condition ratings 2026 season opened weaker than the two prior years for the major crops. In 2024 and 2025, corn held strong good-to-excellent shares through early summer. The 2026 start trailed both, mostly on the drought in wheat country and the wet-dry split in the Corn Belt.
Historical context helps here. A below-average May reading does not lock in a poor harvest. Crops in 2019 started slow after wet planting and still finished near trend. The lesson holds for 2026: early ratings set the tone, not the final score.
Year-over-year comparison is built into every report. The year-ago column sits right next to the current figure. Reading the USDA crop condition ratings 2026 numbers against 2025 shows whether the crop is truly behind or simply following a normal early-season dip.
How Traders and Farmers Use the Ratings
USDA crop condition ratings 2026 releases move markets within minutes. Grain futures on the Chicago Board of Trade react to surprises against expectations. Here is how different groups read the data.
Traders compare the actual good-to-excellent figure to pre-report estimates. A number three points below expectations can lift corn futures. A number above expectations can pressure them.
Farmers use the ratings to gauge regional competition and marketing timing. A weak national crop can signal stronger prices ahead, shaping when they sell.
Analysts feed the ratings into yield models. Firms combine condition data with weather forecasts and satellite imagery to project the final harvest.
Do the Ratings Predict Yield?
Ratings predict yield better as the season matures. Research from the University of Illinois farmdoc team shows a moderate correlation early and a strong one by late summer. The good-to-excellent figure alone does not set yield, but combined with a full season of data, it becomes a reliable signal.
One caution applies. A crop can rate “good” all summer and still disappoint if pollination or grain fill hits a rough stretch. The ratings measure appearance, not final bushels.
Pasture, Rangeland, and Cattle
USDA crop condition ratings 2026 data covers more than row crops. NASS also rates pasture and rangeland each week, and those numbers matter for the beef sector. When pasture ratings fall, ranchers face higher feed costs and tougher grazing decisions.
The 2026 Plains drought hit pasture as hard as it hit wheat. Poor grazing conditions push cattle producers to buy hay or thin their herds sooner. That feeds through to cattle supply and, eventually, beef prices at the store.
Rangeland ratings use the same five-category scale. Watching pasture alongside the crop numbers gives a fuller read on farm-sector stress in any given week. A dry summer that drags on crops usually drags on grazing land too.
Reading the Weekly Crop Progress Report
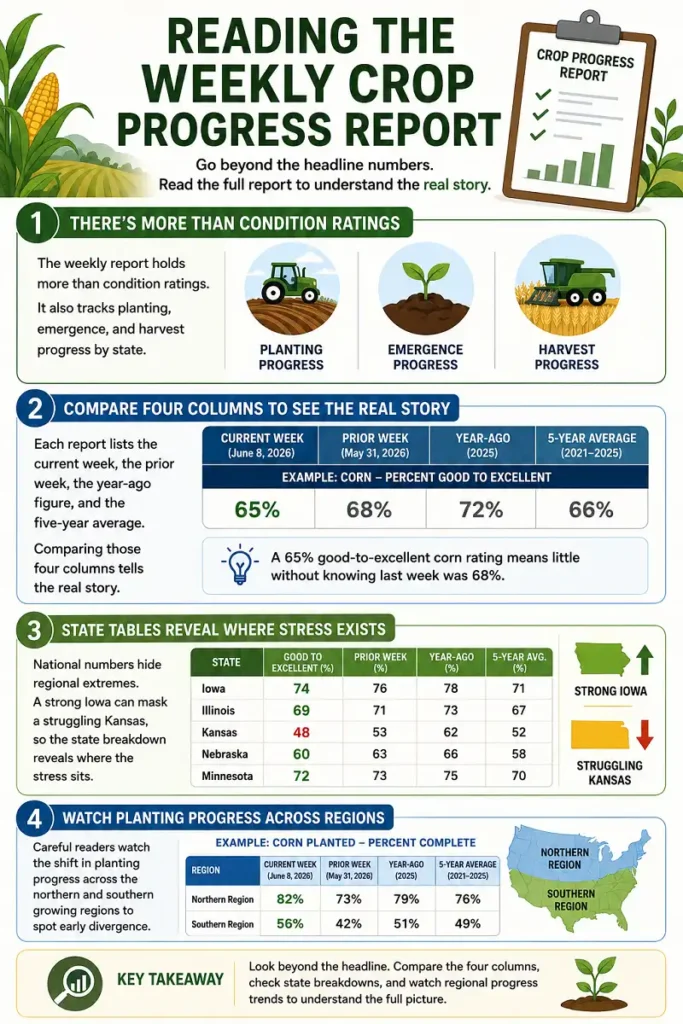
The weekly report holds more than condition ratings. It also tracks planting, emergence, and harvest progress by state. To get the most from the USDA crop condition ratings 2026 data, read the full document.
Each report lists the current week, the prior week, the year-ago figure, and the five-year average. Comparing those four columns tells the real story. A 65% good-to-excellent corn rating means little without knowing last week was 68%.
State tables matter too. National numbers hide regional extremes. A strong Iowa can mask a struggling Kansas, so the state breakdown reveals where the stress sits. Careful readers watch the shift in planting progress across the northern and southern growing regions to spot early divergence.
Where to Find the Official Data
NASS publishes the Crop Progress report free on its website every Monday during the season. The USDA crop condition ratings 2026 figures also appear through the agency’s Quick Stats database, which allows historical comparison.
For context on the reporting agency, the National Agricultural Statistics Service Wikipedia page outlines its history and survey methods. Many market data services also republish the numbers minutes after release.
Key Factors Shaping the 2026 Ratings
Several forces drive the USDA crop condition ratings 2026 trend line this year. Weather leads, but it is not the only factor.
Drought: The Plains drought remains the dominant story. Expanding dryness in wheat country pulled early ratings lower.
Excess moisture: The eastern Corn Belt saw the opposite problem. Heavy spring rain delayed planting and stressed young plants.
Planting timing: Late planting can lower early ratings, since delayed crops face more risk during summer heat.
Input decisions: Fertilizer timing and seed choices shape how crops handle stress, feeding into the weekly scores.
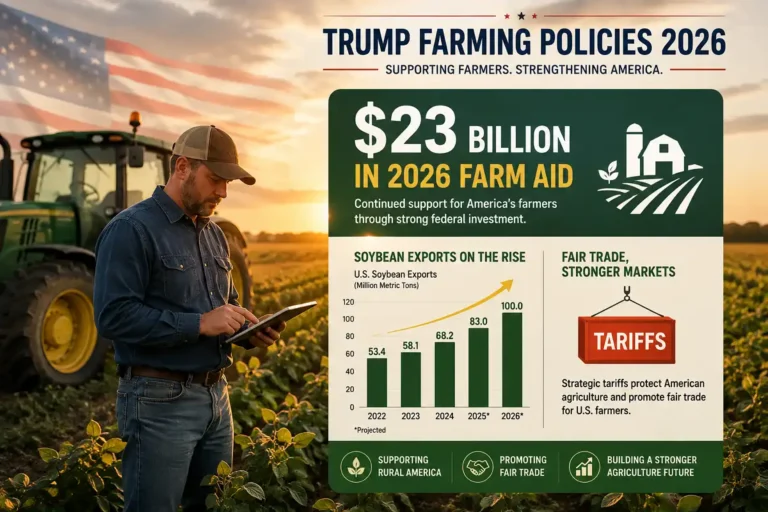
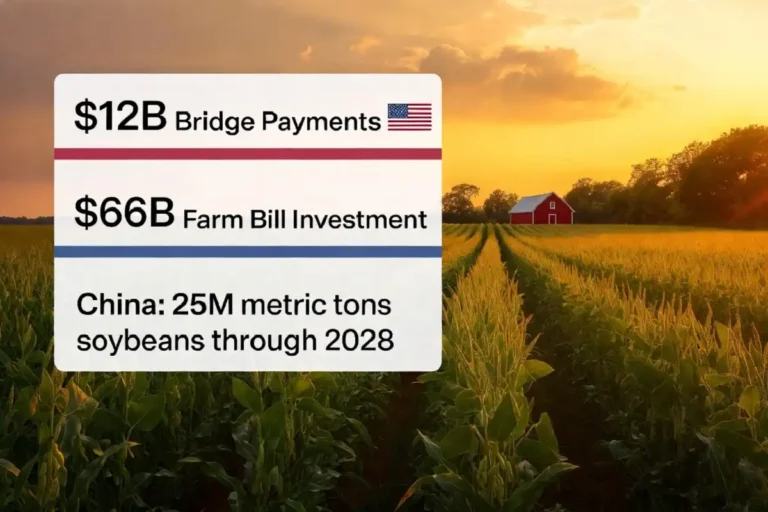
Keeping up with the direction of federal farm policy under the current administration also helps readers understand the backdrop, since support programs and trade moves affect what growers plant and how much risk they take.
Common Mistakes When Reading the Ratings
Readers often misread USDA crop condition ratings 2026 data. Avoid these traps.
First, do not fixate on a single week. Weather noise creates swings that reverse fast. The trend across several weeks tells the truer story.
Second, do not ignore state tables. The national figure averages out real regional pain. A calm headline can hide a crisis in one growing region.
Third, do not treat ratings as a yield guarantee. They measure current appearance, not final output. Pollination and grain fill still decide the harvest.
FAQs

When Does USDA Release Crop Condition Ratings?
Which Crops Get Rated First Each Year?
Are the Ratings Ever Revised?
How Accurate Are the Ratings for Predicting Prices?
What to Watch Next
The USDA crop condition ratings 2026 season still has key turning points ahead. Corn pollination in July and soybean pod fill in August will drive the most important readings of the year. Watch the good-to-excellent trend through those weeks, not any single number.
Winter wheat harvest results will confirm whether the weak spring ratings translated into a small crop. And the Plains drought outlook remains the variable that could swing prices most. Check the NASS Crop Progress report each Monday, compare all four data columns, and read the state tables for the full picture.