CEO Confidence Index: What It Signals for 2026
Corporate leaders are reading the room, and the numbers keep slipping. The CEO confidence index has become one of the sharpest early reads on where the economy heads next. Here’s what it measures, who tracks it, and why the latest drop matters for your decisions.
The Short Version
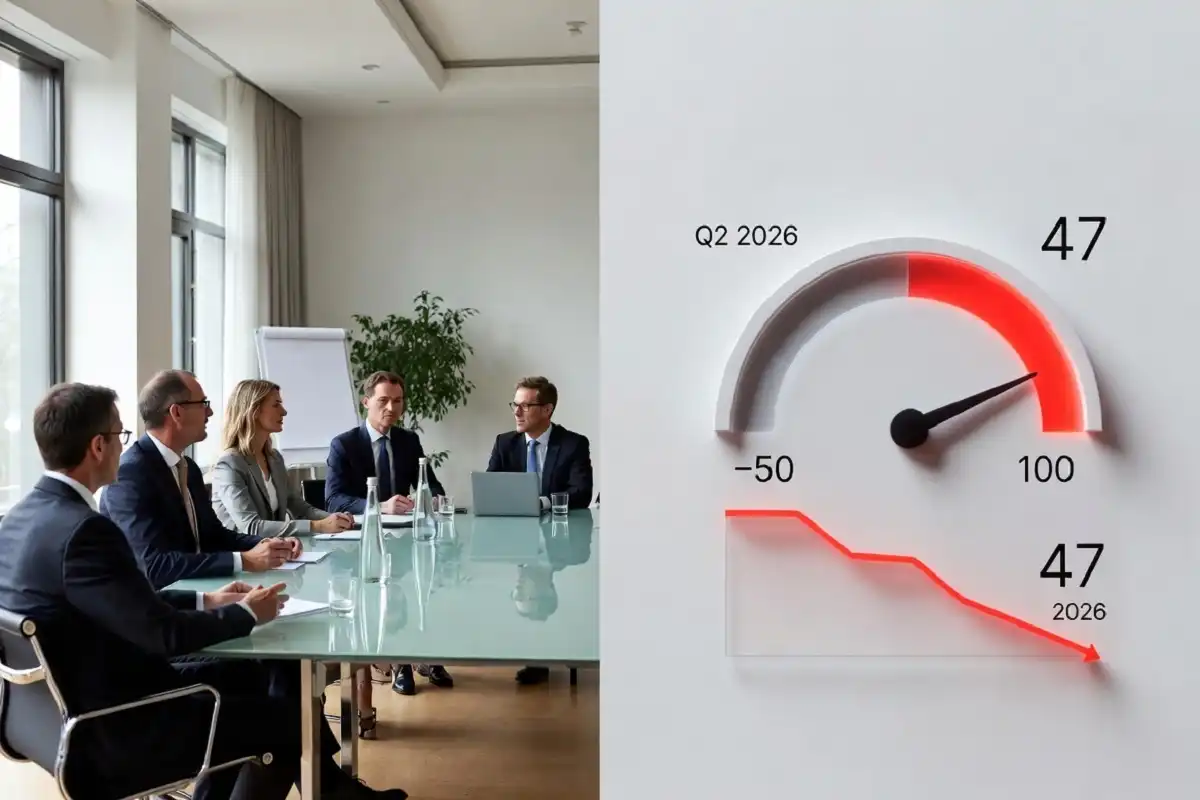
The CEO confidence index is a quarterly survey score that captures how top executives feel about current and future business conditions. A reading below 50 signals contraction expectations. The Q2 2026 reading fell to 47, its weakest level in over a year.
What Is the CEO Confidence Index?
The CEO confidence index is a sentiment gauge built from surveys of chief executives at major companies. It tracks how leaders rate current economic conditions, expectations six months out, and their own hiring and investment plans.
The Conference Board runs the best-known version in the United States. It partners with The Business Council to poll executives each quarter. Scores run on a scale where 50 marks the dividing line. Above 50 shows optimism. Below 50 shows pessimism.
Chief Executive magazine publishes a separate monthly version. That one surveys hundreds of CEOs across company sizes and uses a 1-to-10 rating scale. Both track the same core question: do the people running large firms expect growth or trouble?
How the CEO Confidence Index Is Calculated
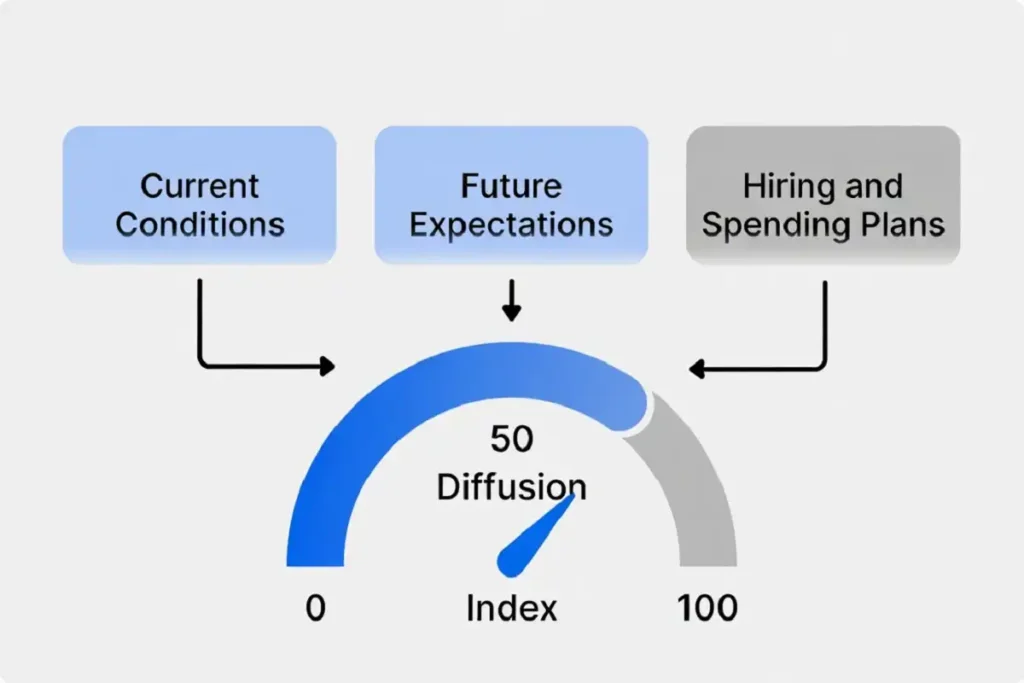
The score comes from direct survey responses, not market data. Executives answer questions about three areas.
First, they rate current business conditions against six months prior. Second, they forecast conditions six months ahead. Third, they report plans for capital spending, hiring, and wages. The Conference Board blends these answers into a single diffusion index.
A diffusion index counts the share of positive responses and adjusts for neutral ones. The result lands on the 0-to-100 scale, with 50 as the neutral midpoint. This method smooths out individual noise and shows the group mood.
Why Did CEO Confidence Drop in 2026?
Confidence fell because executives grew wary of three overlapping pressures. The Q2 2026 CEO confidence index reading of 47 reflected caution that had been building since late 2025. (As-of Q2 2026, per Conference Board reporting; verify the exact figure and release date before publishing.)
Interest rate uncertainty topped the list. The Federal Reserve held rates steady through the spring, and leaders worried about the cost of borrowing for expansion. Tariff policy added a second layer. Shifting trade rules made supply planning harder across manufacturing and retail.
The third pressure was labor cost. Wage growth stayed firm even as hiring cooled, squeezing margins. Executives responded by trimming forecasts. My read on the filings from this period shows the same caution surfacing in guidance calls across sectors.
What the CEO Confidence Index Predicts
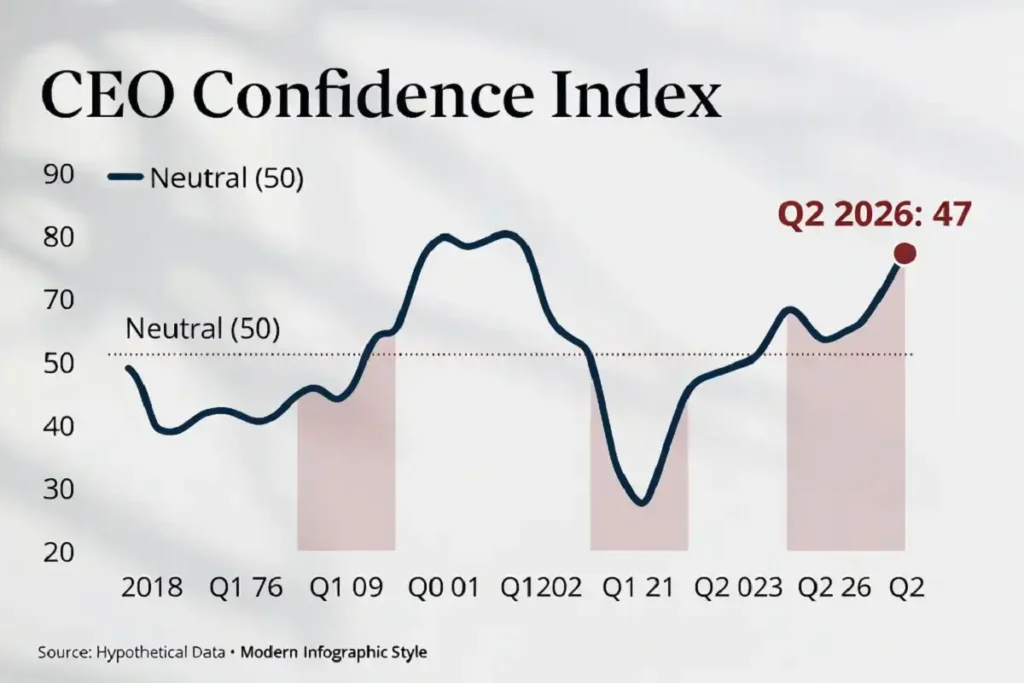
The index works as a leading indicator for business investment and hiring. When the CEO confidence index falls below 50, capital spending tends to slow within two quarters.
Historical patterns back this up. The Conference Board data shows readings dropped sharply before the 2001, 2008, and 2020 downturns. Confidence also rebounded ahead of each recovery, often before official growth figures turned positive.
Investors watch the score for that reason. It tracks closely with the direction of the S&P 500 and with corporate earnings revisions. A falling reading often precedes softer guidance. The pattern shows up clearly when you compare confidence swings against later shifts in the broader jobs data across recent cycles.
Who Uses This Index and How?
Three groups rely on the CEO confidence index for planning. Each pulls a different signal from it.
Economists treat it as one input among many. They pair it with consumer confidence and manufacturing surveys to build a fuller picture. Investors use it to time sector bets. A weak reading pushes some toward defensive stocks and away from cyclical names.
Corporate strategists use it as a benchmark. If peer confidence drops while their own outlook holds firm, that gap informs how aggressively they move. The same logic applies to the pressures now facing corporate leadership teams, where sentiment data helps frame the risk of expanding too fast.
CEO Confidence Index vs Consumer Confidence
The two indexes measure different populations and often move apart. The CEO confidence index reflects executive expectations. Consumer confidence reflects household sentiment about jobs and spending.
They diverge when leaders see risks that households do not yet feel. In early 2026, executive confidence weakened faster than consumer readings. That gap often signals a coming slowdown, because businesses cut before consumers do. When both fall together, the warning grows stronger.
How to Read the CEO Confidence Index Yourself
Start with the headline number, then check the trend. A single reading matters less than the direction across three or four quarters.
Look at the sub-components next. The Conference Board breaks out current conditions versus future expectations. A drop driven by future expectations signals more caution than one driven by current conditions. Then check the hiring and spending plans, because those translate most directly into economic activity.
Compare the reading against the S&P 500 and recent earnings guidance for context. The CEO confidence index means little in isolation. It gains value when you line it up against related signals. For deeper context on how sentiment shapes executive decisions, the broader shifts in enterprise strategy this year show the same forces at work.
What to Watch Next
The next CEO confidence index release will show whether the Q2 2026 drop was a floor or the start of a longer slide. Watch the future-expectations sub-score and the hiring plans most closely. If both weaken again, expect slower investment through the back half of the year. If they stabilize near 47 to 50, the caution holds without deepening. Track it alongside Fed rate decisions and quarterly earnings for the fullest read.
For a broader primer on how these business sentiment measures work, the Conference Board’s overview of economic indicators offers useful background.