Workplace Productivity Data: What the 2026 Numbers Actually Show
Workplace productivity data just sent a mixed signal for 2026. Output per hour is still rising, but the pace is cooling, engagement is falling, and AI’s payoff depends almost entirely on how a company is structured.
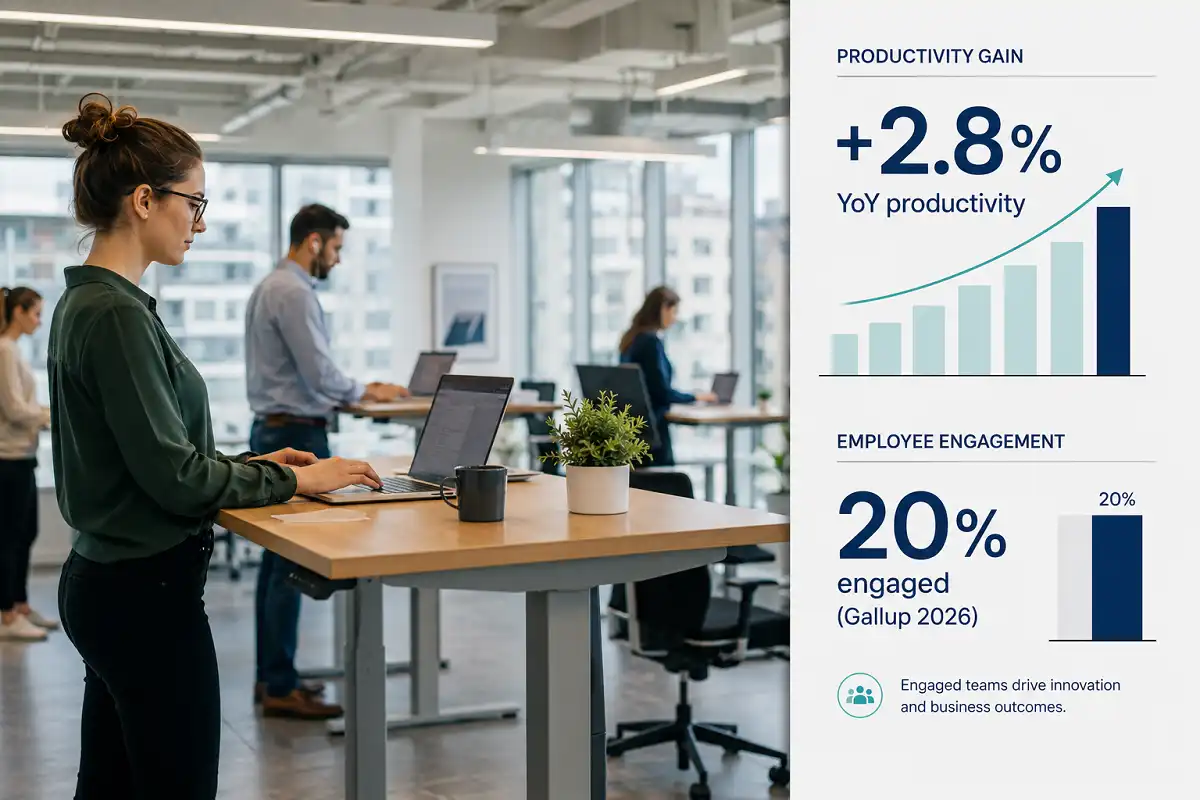
Workplace productivity data for 2026 shows nonfarm output per hour up 2.8% year over year, but only 0.3% quarter over quarter, per the Bureau of Labor Statistics. Engagement fell to 20% globally, per Gallup, and AI gains concentrate in structured tasks.
What Counts as Workplace Productivity Data
Workplace productivity data is any measurable record of how much output a company, industry, or economy generates per unit of labor input. That usually means output per hour worked, but the category also covers engagement scores, absenteeism rates, and technology adoption metrics that predict future output.
I track three layers of workplace productivity data in my reporting: macro data from government agencies, engagement data from research firms, and internal data companies collect on their own teams. Each layer answers a different question. The macro numbers tell you what the whole economy did. The engagement numbers tell you why. The internal numbers tell you what to do about it.
The Latest Workplace Productivity Data From the BLS
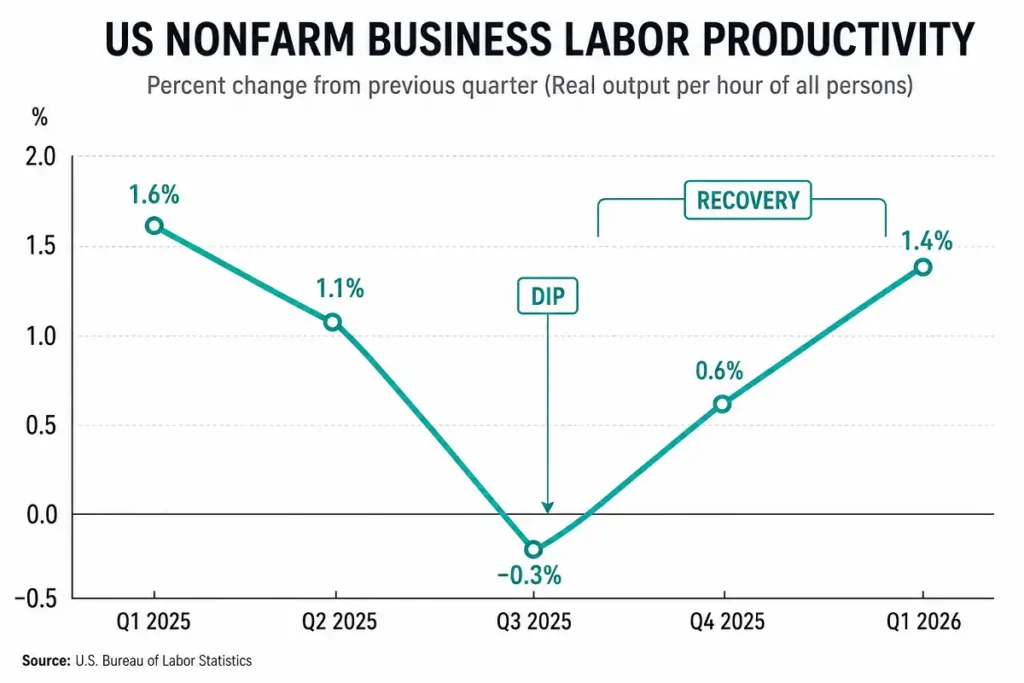
Nonfarm business sector labor productivity rose 0.3% in the first quarter of 2026, according to the Bureau of Labor Statistics’ revised release covering that period. Output climbed 1.0%, while hours worked rose 0.7%.
That quarterly figure looks weak next to the annual trend. From the same quarter a year earlier, nonfarm productivity increased 2.8%, driven by 3.2% output growth. The BLS called the Q1 reading the smallest quarterly increase in nonfarm business sector labor productivity since Q1 2025, when productivity actually fell 0.9%.
Manufacturing told a different story. Manufacturing sector labor productivity jumped 3.2% in Q1 2026, with output up 3.3% and hours worked essentially flat.
Why Unit Labor Costs Matter Here
Unit labor costs rose 1.8% in the nonfarm business sector over the trailing four quarters, the BLS reported. That number reflects a 2.1% rise in hourly compensation against just a 0.3% gain in productivity. When compensation outpaces productivity, businesses either absorb thinner margins or pass the cost through to prices. This is the mechanism connecting output figures to inflation and wage negotiations, and it’s a line I watch every quarter in my coverage of labor markets.
Full-year 2025 wasn’t much stronger. Nonfarm productivity growth slowed to 2.1% for the year, down from 3.0% in 2024, based on BLS annual figures. Total factor productivity, a broader measure that accounts for capital and other inputs alongside labor, rose just 0.8% in the private nonfarm business sector in 2025.
Which Industries Show Up Strongest in the Data
Not every sector moved the same direction. BLS industry-level figures show productivity increased in 20 of 31 selected service-providing industries in 2024, the most recent full year with complete industry detail available at publication. That split matters for hiring plans. A services company sitting in one of the 11 lagging industries is fighting a different headwind than one in an industry already posting gains, and blanket productivity targets set at the corporate level rarely account for that gap.
Labor’s share of nonfarm business income also deserves attention here. It fell to 54.1% in Q1 2026, the lowest reading since the BLS began tracking the series in 1947, according to Indeed’s Hiring Lab analysis of the same BLS release. When labor’s share of income drops while productivity keeps climbing, more of the value created by workers is flowing to capital rather than wages. That’s a structural shift, not a one-quarter blip, and it’s worth tracking alongside the headline productivity number.
Why Employee Engagement Data Belongs in Any Productivity Conversation
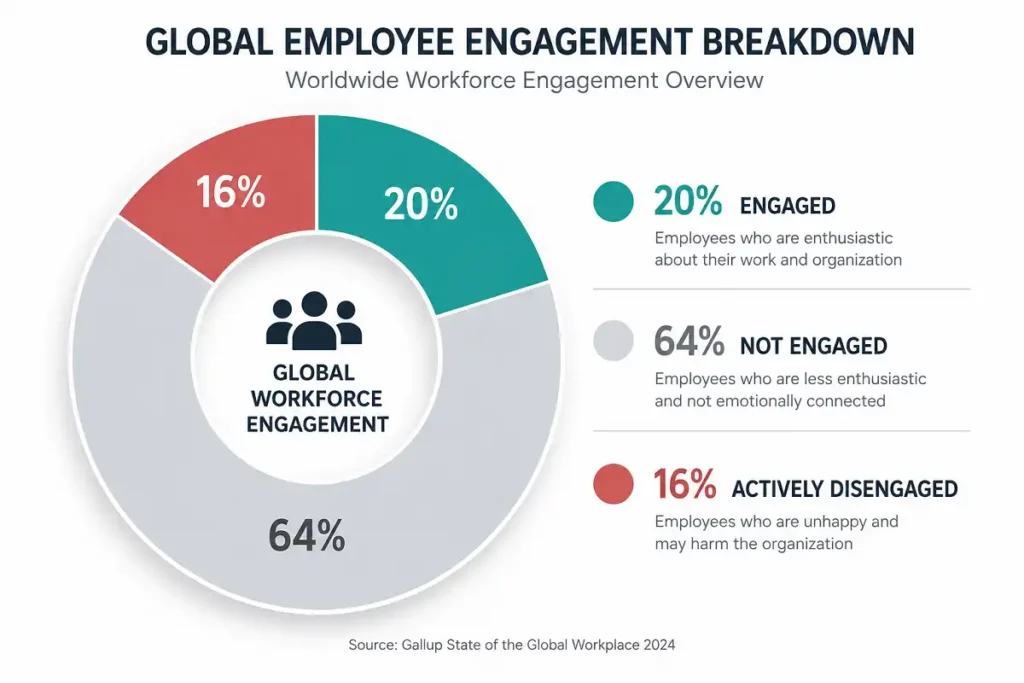
Output per hour only tells part of the story. Gallup’s State of the Global Workplace 2026 report found that just 20% of employees worldwide were engaged in 2025, down from a peak of 23% in 2022. It’s the first time Gallup has recorded two straight years of decline in more than a decade of tracking.
Gallup puts the economic cost of that disengagement at roughly $10 trillion in lost productivity worldwide, or about 9% of global GDP. In the United States, engagement sat at 31% in 2024, an 11-year low for the country, according to Gallup’s data.
The steepest decline came from managers, not individual contributors. Manager engagement dropped nine percentage points since 2022, falling five points alone between 2024 and 2025, from 27% to 22%. Individual contributor engagement declined too, but with a slight rebound. That gap matters because managers historically carried an “engagement premium” over the people they supervised. Gallup’s latest read shows that premium has mostly disappeared.
The Human Cost Behind the Numbers
Wellbeing is sliding alongside engagement. Only 34% of employees globally rate their lives as thriving, per Gallup, while 40% reported significant stress the day before being surveyed. Managers report higher stress, anger, sadness, and loneliness than individual contributors, even though they’re more engaged on paper. That combination, high engagement paired with worse mental health, points to a workforce where the most invested employees are also the most likely to burn out.
How AI Is Reshowing Up in Workplace Productivity Data
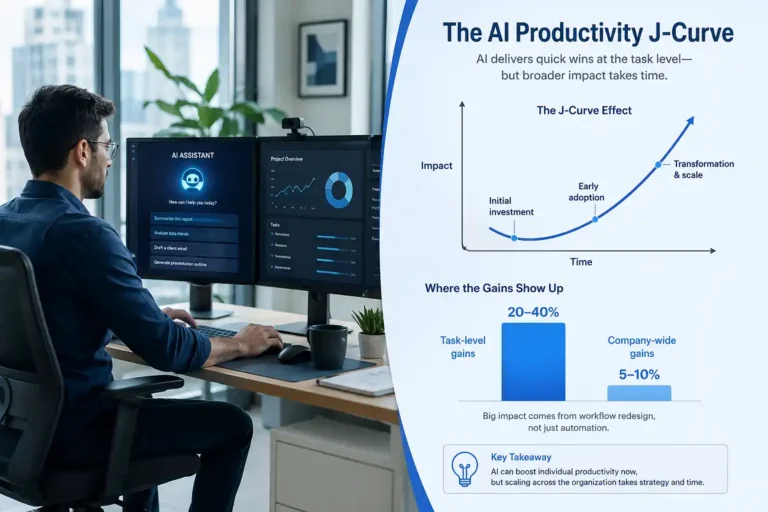
AI adoption has moved fast enough to actually register in the output figures, but the gains are uneven. Stanford’s HAI AI Index 2026 found 88% of organizations report using AI in at least one business function as of 2025, with 70% using generative AI specifically.
The size of the payoff depends on how structured the task is. Stanford’s index found reported productivity gains of 14% to 15% in customer support, 26% in software development, and as high as 73% in marketing output, while gains shrink in work that requires open-ended judgment. A widely cited NBER working paper by Brynjolfsson, Li, and Raymond studied 5,172 customer support agents and found a 15% average productivity improvement, with a 34% gain for less experienced workers and almost no effect on top performers.
Why Most Companies Aren’t Capturing These Gains
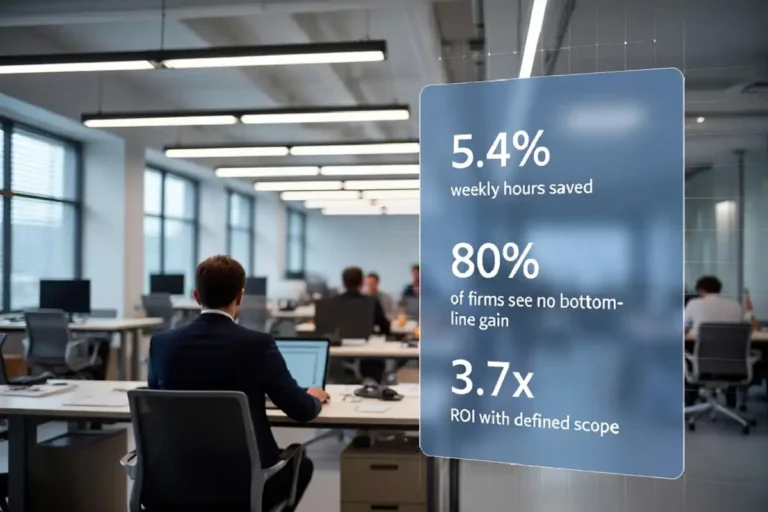
Microsoft’s 2026 Work Trend Index, based on trillions of anonymized Microsoft 365 signals and a survey of 20,000 AI-using knowledge workers, found only 16% of AI users qualify as “Frontier Professionals” who have actually redesigned workflows around AI. The rest are bolting AI onto processes that haven’t changed. Among those frontier users, 80% report producing work they couldn’t have produced a year earlier, compared with 58% of AI users overall.
Microsoft’s analysis attributes 67% of AI’s real workplace impact to organizational factors, like culture, manager support, and training, rather than individual skill. That finding echoes a separate Gallup survey cited in its 2026 workplace report, where 89% of leaders said they saw no measurable labor productivity impact from AI, even as individual workers reported personal gains. The disconnect is the story right now: individual-level output looks promising, while enterprise-wide numbers lag behind.
How Companies Are Acting on Workplace Productivity Data
The slowdown in output growth and the drop in engagement are pushing some employers toward structural changes rather than one-off perks. A growing number of US firms are testing shorter weekly schedules as a response to flat output per worker, betting that fewer hours with sharper focus beats more hours with declining engagement. Early adopters report the same pattern Stanford found in AI: gains show up fastest in roles with clear, measurable output.
Other companies are leaning on how AI is reshaping day-to-day output across departments to offset flat headcount growth, rather than expanding teams. The companies getting real value, per Microsoft’s data, are the ones treating AI as a workflow redesign project instead of a tool rollout.
How to Track Workplace Productivity Data at Your Company
Use these steps to build a workplace productivity data practice that actually informs decisions, not just a dashboard nobody checks.
- Pick one output measure per role type. Revenue per employee works for sales. Tickets closed per hour works for support. Pick a number tied to real business value, not activity.
- Pair output data with engagement data. A team hitting its numbers while burning out will miss next quarter’s numbers. Run a short quarterly pulse survey alongside your output metrics.
- Segment by tenure and role. Aggregate company-wide productivity numbers hide where the actual gains and losses are happening. Break the data down by team and experience level before drawing conclusions.
- Track AI usage against outcomes, not adoption. Login counts don’t measure value. Compare output before and after AI tools reach a team, using the same output measure from step one.
- Review quarterly, not annually. The BLS revises its own numbers monthly. An annual review misses shifts that matter for staffing and budget decisions.
Common Mistakes When Reading Workplace Productivity Data
Confusing hours worked with output. More hours logged doesn’t mean more value created. The Q1 2026 BLS data makes this explicit: hours worked rose 0.7% while productivity growth was nearly flat, meaning companies added labor without adding proportional output.
Treating engagement as a soft metric. Gallup ties a $10 trillion global cost to disengagement. That’s a hard number attached to what many leaders still treat as a culture nicety.
Assuming AI adoption equals AI value. Stanford and Microsoft’s workplace productivity data both show a wide gap between using AI and redesigning work around it. Adoption rates alone tell you almost nothing about output.
Ignoring the manager layer. Gallup’s data shows managers driving most of the recent engagement decline. Any workplace productivity data review that only looks at frontline output misses where the erosion usually starts.
This connects to the broader academic concept of labor output per hour worked, which economists have measured for decades as the baseline for judging whether an economy, or a company, is actually getting more efficient over time.
FAQs

Is Workplace Productivity Data the Same as Employee Performance Data?
How Often Does the Government Update Workplace Productivity Data?
Does Remote Work Show Up in Workplace Productivity Data?
Why Do Small Businesses Need Their Own Workplace Productivity Data?
What This Means Going Forward
Workplace productivity data for 2026 points to a slower, choppier growth pattern than 2025’s surge. The next BLS release, covering Q2 2026, is scheduled for August 6, 2026, and will show whether Q1’s slowdown was a blip or a trend. Watch three numbers: quarterly output growth, Gallup’s next engagement read, and the share of AI users who’ve actually redesigned their workflows. Companies that move on all three tend to separate from the pack faster than the topline productivity data suggests.